Category Archives: Blog

Your blog category

How Crypto Wallets Work

In the world of cryptocurrency, ownership and control of digital assets depend entirely on how you manage and store your cryptographic keys. At the heart of every crypto wallet are four core components: private keys, public keys, wallet addresses, and recovery phrases (also known as seed phrases or mnemonic phrases). Understanding how these pieces work together is essential to managing your crypto securely.

What Is a Crypto Wallet?

A crypto wallet is not a place where coins are physically stored. Instead, it’s a tool that lets you interact with blockchain networks by managing the keys that prove ownership of your digital assets.

There are two main types of crypto wallets:

  • Custodial Wallets: Managed by third parties (like exchanges), where your private keys are held on your behalf. Convenient, but you’re trusting someone else with your funds.
  • Non-Custodial Wallets: You hold and manage your own keys, giving you full control—and full responsibility—over your assets.

These can further be divided into:

  • Hot Wallets: Connected to the internet. Ideal for frequent transactions but more exposed to online threats.
  • Cold Wallets: Stored offline. Greatly reduces the risk of hacks and is preferred for long-term storage.

The Core Elements of Every Crypto Wallet

No matter the type, every crypto wallet relies on a few fundamental components:

  • Private key – for sending funds
  • Public key – for verifying transactions
  • Wallet address – for receiving funds
  • Seed phrase – for backing everything up

Private Key

Every crypto wallet is built around a private key. When you create a new wallet, the system automatically generates one for you.It’s a long string of letters and numbers.

Example: 5Kb8kLf9zgWQnogidDA76MzPL6TsZZY36hWXMssSzNydYXYB9KF

This key allows you to sign transactions and prove you own the funds in the wallet. If someone else gains access to your private key, they can spend your crypto. Losing your private key means losing access to your funds—permanently.

When you send funds, your wallet uses the private key to digitally sign the transaction, proving you own the assets being moved. This signature is verified by the network using your public key—without ever exposing the private key itself.

In software wallets (like mobile or desktop apps), private keys are encrypted and stored locally on your device. In hardware wallets, keys stay safely inside the device and never touch the internet.

Public Key

Your public key is mathematically derived from your private key. It’s safe to share and is used by the blockchain to verify transactions signed by your private key.

While the public key allows anyone to verify transactions and send you funds, only the private key allows you to spend or transfer those funds. Importantly, while the public key can be mathematically derived from the private key, the reverse is practically impossible due to cryptographic design.

Public keys are also stored in your wallet, but since they don’t grant access to your funds, there’s no harm in exposing them. While you don’t often use the public key directly, it’s important to understand that it acts as a link between your private key and your wallet address. The public key is used to create your wallet address, which is what you give out to receive crypto.

Wallet Address

Your wallet address is the part most people interact with. It’s what you give someone when they want to send you crypto. It tells the blockchain where to send crypto. Anyone can view transactions to and from this address (blockchains are public!), but no one can access the funds without the private key.

When someone sends you crypto, they’re sending it to this address. But remember, only you (with your private key) can actually move that crypto once it arrives.

Seed Phrase

Since private keys are complex and difficult to memorize, wallets generate a seed phrase—a human-readable backup of your private key(s), usually made up of 12 or 24 random words.

Example:
window carpet lava planet coffee smile lava whale exile gym giggle lobster

Seed phrase can regenerate all private keys associated with your wallet. If your device is lost, damaged, or reset, you can restore your wallet on any device to restore full access to your funds. 

Anyone with your seed phrase can access your wallet, so keep it safe, offline, and never share it. Never store it in your email, cloud storage, or messaging apps.

Single-Key vs. Multi-Key Wallets

Wallets can be configured with different key structures:

  • Single-Key Wallets: Use one private key to manage one or more addresses. Common in personal wallets like MetaMask or Trust Wallet. Simple and user-friendly.
  • Multi-Key Wallets: Some wallets are Hierarchical Deterministic (HD), allowing many key pairs to be derived from a single seed phrase. Others are multi-signature (multisig) wallets, requiring multiple private keys to approve a transaction—ideal for shared accounts or increased security.

How It All Works Together in a Transaction

Let’s look at a typical flow of events in a crypto transaction:

1. You Create a Wallet

  • Your wallet generates a private key.
  • A public key is created from your private key.
  • A wallet address is created from the public key.
  • A seed phrase is generated to back it all up.

If you’re using an HD wallet, multiple addresses and key pairs can be managed under one seed.

2. Someone Sends You Crypto

  • You give them your wallet address.
  • They send crypto to that address.
  • The transaction is recorded on the blockchain.
  • Only your private key can unlock or move the funds.

3. You Want to Send Crypto

  • You open your wallet app and choose the amount to send.
  • The app uses your private key to sign the transaction (this proves it’s really you).
  • The network checks your public key to confirm the transaction is valid.
  • The crypto is sent and the transaction is recorded on the blockchain.

Final Thoughts

When people say they “own cryptocurrency,” what they really mean is that they control the private key linked to that cryptocurrency on the blockchain. The blockchain records all transactions publicly, so anyone can verify ownership using the public key. However, only the holder of the private key can authorize spending.

Lose your private key or seed phrase, and you lose access to your crypto—permanently. There’s no recovery service or password reset. That’s why secure management of your wallet information is absolutely critical in crypto.

In Summary

  • Private Key: Automatically generated when you create a wallet. It’s stored securely in the wallet and used to sign transactions. You don’t interact with it directly.
  • Public Key: Derived from the private key. Used to verify your transactions and generate your wallet address.
  • Wallet Address: Shared with others to receive funds. Functions as your “account number” in the crypto space.
  • Recovery Phrase: A human-readable backup of your private key(s). Stored safely to recover access to your wallet if needed.

Understanding how private keys, public keys, and seed phrases work is critical for anyone involved in crypto.  With the right knowledge, you’ll be well on your way to becoming a confident and secure crypto investor.

 Learn before you send — mistakes in crypto can be permanent

Reference:

https://www.investopedia.com/terms/p/private-key.asp

 https://blocktrade.com/wallet-addresses-public-and-private-keys-explained

https://www.gemini.com/cryptopedia/public-private-keys-cryptography

https://trustwallet.com/blog/security/private-key-vs-recovery-phrase

India in the News: Words That Defined the UPA and NDA Years

When we look back at India’s recent history, political leaders and major events often take center stage. But what if we told you that a simple analysis of news headlines over time can reveal powerful insights into what the nation was truly focused on?

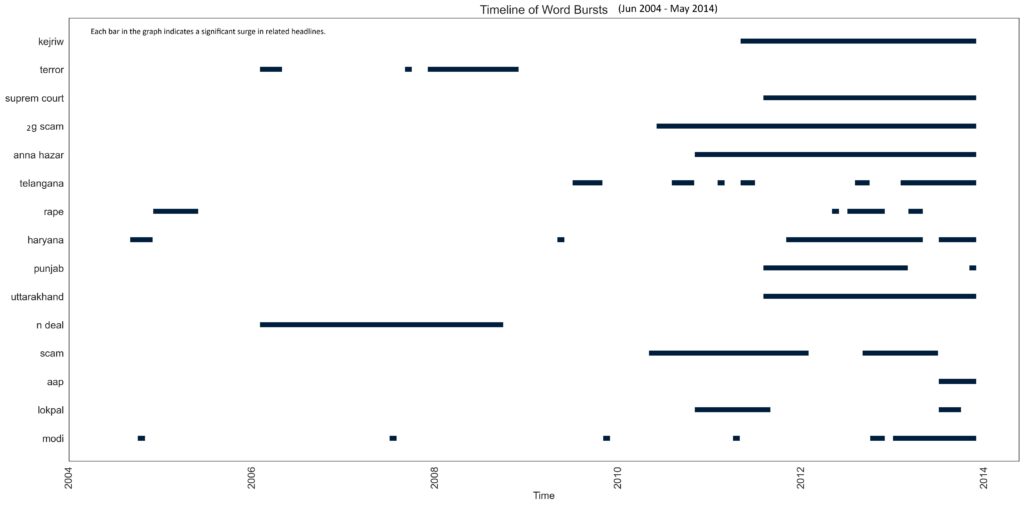
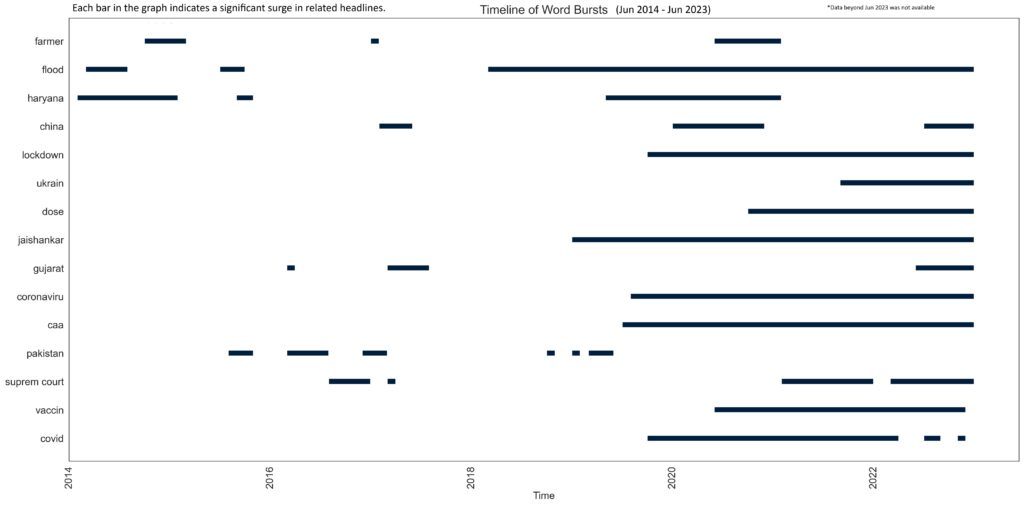
We recently did a burst analysis of news headlines from June 2004 to June 2023—spanning the UPA  rule from 2004 to 2014 and the NDA  rule from 2014 to 2023. 

Don’t worry if you haven’t heard of the term “burst analysis” before. In simple terms, it just means identifying words that suddenly appeared a lot more frequently than usual during certain periods. It’s a way of spotting trends in public discourse.

Where the Data Comes From

The data for this analysis was collected from a Kaggle.com (data science platform). It includes headlines between June 2004 and June 2023, from top Indian publication. Data beyond June 2023 was not available.

What Grabbed Headlines During the UPA Rule (2004–2014)

The UPA government led by Dr. Manmohan Singh saw some major national and international developments. Here are some of the top terms that dominated headlines during this period:

  • Nuclear Deal (2006–2009): India’s civil nuclear agreement with the United States sparked a political storm and dominated news for several years.
  • Anna Hazare & Kejriwal (2011 onwards): The anti-corruption movement launched by Anna Hazare and Arvind Kejriwal caught the nation’s attention like wildfire. It led to the birth of the Aam Aadmi Party.
  • 2G Scam: This major telecom scandal remained in the news through the later UPA years.
  • Aam Aadmi Party & Narendra Modi (2013–2014): As the 2014 elections approached, Arvind Kejriwal’s party and Narendra Modi became frequent mentions in headlines.

This period was marked by political turmoil, civil activism, and scandals, shaping the nation’s mood and media focus.

Buzzwords from the NDA Rule (2014–2023)

As the NDA government took over under Prime Minister Narendra Modi, the news cycle took a sharp turn towards other pressing concerns:

  • Flood (2018 onwards): Natural disasters, especially floods in various parts of the country, were frequently in the headlines.
  • Lockdown, Coronavirus, COVID, Vaccine (2020 onwards): Like the rest of the world, India’s attention sharply turned to the pandemic. These terms surged in frequency and dominated public discourse.
  • CAA (Citizenship Amendment Act): This became a focal point of national debate and protests around 2019–2020.

These years were shaped by public health crises, environmental challenges, and major policy debates.

What Does This All Mean?

When we step back and look at the big picture, it’s clear that different issues dominated the national consciousness at different times:

  • UPA years were filled with policy negotiations, anti-corruption movements, and political transitions.
  • NDA years were marked by crises (natural and medical), nationalistic policies, and global health emergencies.

It’s a reminder that the issues we care about most aren’t just shaped by politicians—they’re shaped by circumstances, movements, and moments that grip the country.

Disclaimer:

This analysis is based on public headline data available on Kaggle.com and reflects trends observed from that dataset. The accuracy and completeness of the dataset cannot be independently verified, and the analysis should be seen as indicative, not definitive.

Market Capitalization Rate vs. Cost of Equity

[latexpage]

Market capitalization rate and the cost of equity are not the same, although they are related concepts in finance. While they both deal with investments, they serve different purposes and contexts. Let’s break them down in simple terms.

Market Capitalization Rate

In the context of the capital markets, the market capitalization rate refers to the expected return on an investment based on its current market value. It’s often used by investors to evaluate the profitability of stocks or portfolios.

It can be expressed as the sum of dividend yield and growth rate, g \[ r = \frac{Dividend_1}{P_0} + g \]

The formula for calculating the market capitalization rate is:

\[ \text{Market Cap Rate} = \frac{\text{Expected Dividends} + \text{Capital Gains}}{\text{Current Market Price}} \]

– Expected Dividends: These are the payments expected to be received from the investment.
– Capital Gains: The anticipated increase in the stock’s price over time.
– Current Market Price: The price at which the stock is currently trading.

Cost of Equity?

The cost of equity is the return that investors expect for holding a company’s equity (i.e., its stocks). It represents the compensation that investors require for the risk they take by investing in the company.

One common method to calculate the cost of equity is the Capital Asset Pricing Model (CAPM):

\[ \text{Cost of Equity} = \text{Risk-Free Rate} + \beta \times (\text{Market Return} – \text{Risk-Free Rate}) \]

– Risk-Free Rate: The return on a risk-free investment, usually government bonds.
– Beta: A measure of the stock’s volatility compared to the overall market.
– Market Return: The expected return of the overall market.

Cost of equity for a firm should not be taken as its personal property. Rather, it should be reflective of the cost of equity of all the firms in same risk class.

Key Differences

  • Purpose:
    • Market Cap Rate: Used to evaluate the expected return on an investment based on its market value, primarily for stocks.
    • Cost of Equity: Represents the return that investors expect from holding a company’s equity, reflecting the risk involved.
  • Context:
    • Market Cap Rate: Commonly discussed in the capital markets for individual stocks or portfolios.
    • Cost of Equity: Often used by companies for financial decision-making, such as evaluating new projects.
  • Calculation:
    • Market Cap Rate: Focuses on dividends and capital gains relative to current market price.
    • Cost of Equity: Considers risk-free rates, market return, and stock volatility.

Conclusion

In summary, while both the market capitalization rate and cost of equity relate to investment returns, they apply to different scenarios and have different implications. Understanding these concepts can enhance your investment strategy, whether you’re assessing stocks or evaluating company performance. Keep learning, and happy investing!

Simple Constant Growth Discounted Cash Flow (DCF) for Market Capitalization Rate

[latexpage]

Using the Simple Constant Growth DCF to Assess Market Capitalization Rate

Valuing a company accurately is crucial for making informed investment decisions, and among the various methods available, the Discounted Cash Flow (DCF) model stands out as a fundamental approach. One of its simpler yet effective variants is the Simple Constant Growth DCF model. This model, also known as the Gordon Growth Model or the Dividend Discount Model (DDM), provides insights into how to determine a company’s market capitalization rate. Let’s explore how this model works and what it means for assessing market value.

What is the Simple Constant Growth DCF Model?

The Simple Constant Growth DCF model is designed to value a company’s stock by assuming a perpetual, constant growth rate in dividends or free cash flows. It’s a straightforward method that hinges on a few key assumptions but offers powerful insights into a company’s value.

Understanding the Basics

In this model, dividends are treated as a perpetuity, meaning they continue indefinitely. The present value of this perpetuity, with a discount rate \( r \) and a growth rate \( g \), can be calculated using the formula:

\[ \text{Present Value} = \frac{\text{Year 1 Cash Flow}}{r – g} \]

For equity, cash flow is equivalent to dividends. Thus, the present value of all future dividend streams can be expressed as:

\[ P_0 = \frac{D_0 \times (1 + g)}{r – g} \]

where:
– \( P_0 \) = Current stock price (or value of the company)
– \( D_0 \) = Dividend just paid
– \( g \) = Constant growth rate of dividends (or free cash flows)
– \( r \) = Required rate of return (market capitalization rate)

To find the market capitalization rate \( r \), rearrange the formula:

\[ r = \frac{D_0 \times (1 + g)}{P_0} + g \]

Estimating the Growth Rate \( g \)

Estimating the growth rate \( g \) is crucial for applying the Simple Constant Growth DCF model effectively. This growth rate can be derived from various sources:

1. Historical Growth Rates:
– Analyze past dividend or earnings growth to project future growth rates.

2. Future Projections:
– Utilize projections from financial analysts or company forecasts.

3. Plowback Ratio and ROE:
– The plowback ratio represents the percentage of earnings reinvested in the business after paying dividends. It is calculated as:
\[ \text{Plowback Ratio} = 1 – \frac{\text{DIV}}{\text{EPS}} \]
– Return on Equity (ROE) is the ratio of earnings to book value. Growth rate can be expressed as:
\[ g = \text{Plowback Ratio} \times \text{ROE} \]
This formula links dividend growth to the company’s reinvestment strategy and profitability.

Implications and Limitations

While the Simple Constant Growth DCF model is valuable, it comes with limitations:

1. Assumption of Constant Growth:
– The model assumes a perpetual, constant growth rate, which may not be realistic for all companies, especially high-growth or volatile stocks.

2. Sensitivity to Inputs:
– Small variations in the growth rate or current stock price can significantly affect the calculated market capitalization rate.

3. Suitability:
– This model works best for companies with stable and predictable dividend policies. It might not be suitable for companies in highly volatile industries or those that do not pay dividends.

4. Market Capitalization Rate Across Stocks:
– It’s often useful to compute the market capitalization rate for a group of similar stocks and take the average to mitigate individual stock anomalies.

Conclusion

The Simple Constant Growth DCF model provides a clear framework for estimating a company’s market capitalization rate, making it an essential tool for investors. By understanding its assumptions and limitations, you can use this model effectively to gauge a company’s value and make more informed investment decisions. Remember, while this model offers a valuable perspective, it should be complemented with other valuation methods for a comprehensive analysis.

Trends and Dynamics in beauty industry

The concept of beauty is deeply ingrained in human culture, yet its definition remains subjective. While some perceive beauty as “skin deep,” others associate it with cosmetics and makeup. The history of cosmetics dates back thousands of years to ancient Egypt, where the first known cosmetic products were used.

In this post, we delve into the public interest surrounding beauty, cosmetics, and makeup using Google Trends data. Analyzing trends since 2004 provides insights into shifting interests and behaviors over time.

Exploring Google Trends

This visual shows the google trends data on search interests for terms such as beauty,’ ‘cosmetics,’ and ‘makeup’.

The chart reveals intriguing patterns. While ‘beauty’ emerges as the most widely searched term, with a slight upward trend, search volume in ‘cosmetics’ remains relatively stable. However, ‘makeup’ displays a recurring spike in searches every October, possibly linked to Halloween festivities.

There is a sudden spike in the search term ‘beauty’ during Mar-2017 which correlates with the release of the movie ‘Beauty and the Beast’.

Evolution of the Beauty Industry

The beauty industry has burgeoned into a $528 billion global market, encompassing skincare, haircare, cosmetics, and fragrance segments. Focusing on cosmetics, we observe its segmentation into lip, eye, and face makeup categories.

The graphic below shows the leading products for each category within cosmetic segment. The sparklines against each product shows the variation of search interest since 2004 till date.

categorization of beauty market

Google trends data on popular search interest of face, eye and lip make up, shows an interesting pattern.

Historically, eye makeup has enjoyed popularity, but a notable shift occured post-2021, with surge in interest in lip makeup, surpassing the Eye makeup search volumes before returning to its normal levels, post Oct 2023.

Easing restrictions on face mask mandates likely influenced this trend, as lips became a focal point of search interest.

Leading Players and Market Dynamics

A few multinational corporations, including L’Oréal Paris, Unilever, Procter & Gamble, and Estée Lauder, dominate the cosmetics market. However, the industry landscape is evolving, with niche brands like Glossier and Fenty Beauty gaining prominence. Clean and sustainable products are increasingly sought after, challenging traditional market leaders.

We examined the correlation between search interest and revenue for top cosmetic companies. While search trends provide insights into consumer behavior, revenue data reflects market performance. Understanding this correlation sheds light on consumer preferences and industry dynamics.

Correlation analysis between search interest and Revenue for top three cosmetic companies is shown below.

Conclusion: The Future of Beauty

The beauty market is evolving rapidly, driven by factors such as social media influence, digitization, e-commerce and influencer marketing. Independent brands are disrupting the dominance of big players, emphasizing clean, sustainable products. Despite shifts in consumer behavior and market dynamics, interest in cosmetics and makeup remains steadfast.

In a world where beauty standards evolve and trends fluctuate, one thing remains constant: the enduring allure of cosmetics and makeup. Whether consumers turn to Google search or social media for beauty insights, the fascination with enhancing one’s appearance continues unabated. As the industry continues to evolve, adaptability and innovation will be key to staying ahead in this dynamic landscape.